Inside of nonprofits, there are many interconnected processes at play. Some are more formal and well understood than others. Most consultants jump in to try to understanding a process by adding a bunch of shapes to a page, connecting them with lines and then when they need to communicate to the user or stakeholder, they resort to swim lanes and eventually, you end up with several connected PDF pages that no one can understand or wants to read (including the author).
I agree that understanding the processes within a nonprofit is the first step in order to analyze and improve them, however we believe that in the majority of cases, the best way to understand a process is to have a high-level perspective. That’s where SIPOC diagrams are a great tool. While business processes can be complex, SIPOC diagrams are a simple way to visualize how each piece of the process fits together – on a single page.
What is a SIPOC diagram?
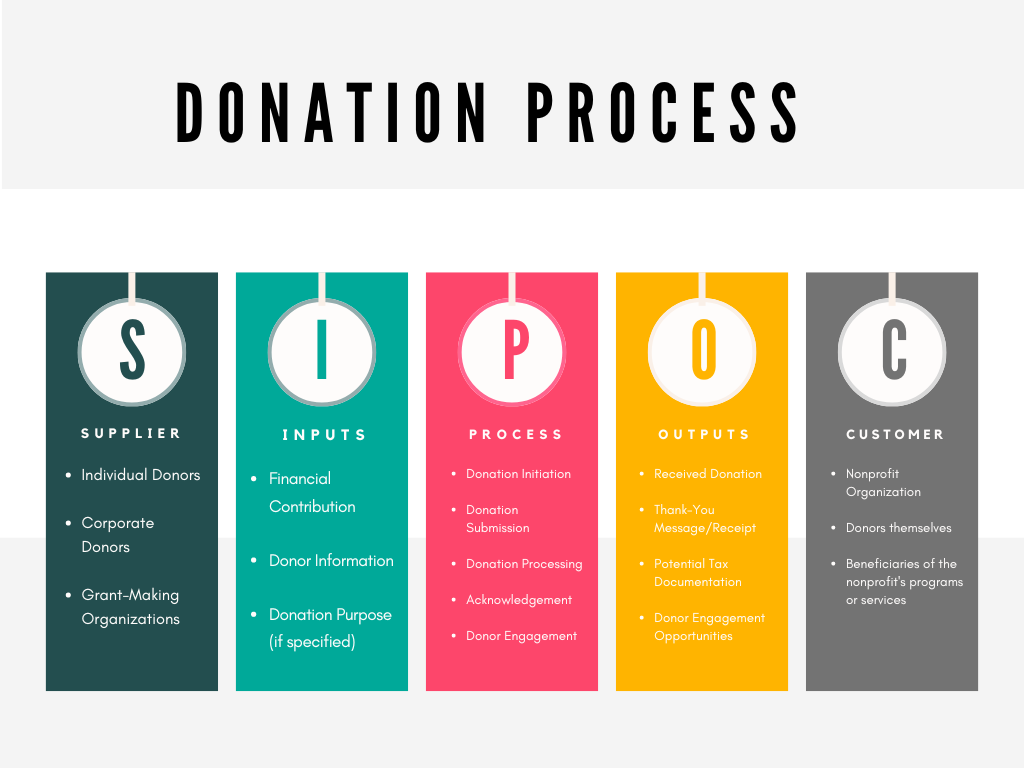
The SIPOC diagram is a type of process map that provides a high-level overview of a process. It breaks down the process into five key parts: Suppliers, Inputs, Process, Outputs, and Customers. By showing how these parts connect, it helps business teams at all experience levels to understand and identify ways to improve processes that affect member and internal staff experiences.
Elements of SIPOC:
What is a SIPOC diagram used for?
SIPOC diagrams are commonly used in lean project management, like Six Sigma, to improve processes and minimize defects. They help:
How to create a SIPOC diagram in 7 steps:
Here are 5 tips 💡 on how to create a well-designed SIPOC diagram:
SIPOC diagrams are a valuable tool for understanding and improving processes in organizations. By using them, nonprofits can improve operations, enhance member satisfaction, and achieve their goals more effectively.